AI-Powered Performance Monitoring & APM 2026: Intelligent Application Insights
Master AI-powered performance monitoring and APM. Automatically detect bottlenecks, predict failures, and optimize application performance with intelligent analysis.
The Evolution of Application Performance Monitoring
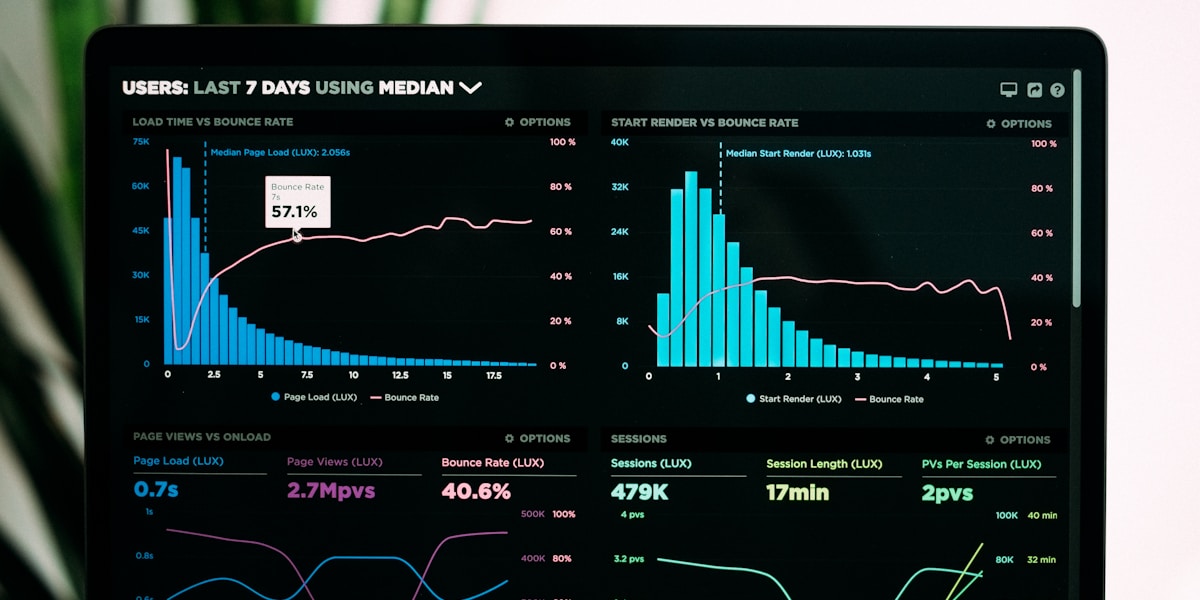
In 2026, AI-powered Application Performance Monitoring (APM) has transformed how we understand and optimize application performance. Traditional APM tools required manual configuration of thresholds and alert rules. Modern AI APM tools learn automatically, detect anomalies intelligently, and predict failures before they occur.
The shift from reactive monitoring to predictive intelligence represents a fundamental change in how we approach application performance. AI doesn't just alert you when things go wrong—it helps you understand why and prevents issues before they impact users.
What Is AI-Powered APM?
AI-powered APM uses machine learning to automatically detect performance issues, predict failures, and suggest optimizations without manual configuration. Unlike traditional APM tools that rely on static thresholds, AI APM:
- Learns normal application behavior automatically
- Detects anomalies using pattern recognition
- Correlates metrics, logs, and traces
- Predicts failures before they occur
- Suggests optimizations based on usage patterns
Leading AI APM Tools in 2026
Datadog AI
Datadog's AI capabilities have evolved significantly. The platform now automatically identifies performance bottlenecks, correlates issues across services, and provides actionable recommendations.
# Datadog AI monitoring setup
# datadog.yaml
ai_monitoring:
  enabled: true
  anomaly_detection:
    sensitivity: medium
    learning_period: 7d

  predictive_alerts:
    enabled: true
    prediction_window: 30m

  auto_correlation:
    metrics: true
    logs: true
    traces: true
New Relic AI
New Relic AI focuses on intelligent observability. It automatically identifies the root cause of performance issues and suggests fixes based on historical data and industry best practices.
# New Relic AI configuration
# newrelic.yml
ai_observability:
  enabled: true
  root_cause_analysis: true
  auto_remediation:
    enabled: true
    actions:
      - scale_up
      - restart_service
      - clear_cache

  insights:
    performance_trends: true
    cost_optimization: true
    capacity_planning: true
Custom AI Monitoring Pipeline
Many teams build custom AI monitoring pipelines using machine learning frameworks. This approach offers maximum flexibility and can be tailored to specific monitoring requirements.
# Python AI monitoring pipeline
import numpy as np
from sklearn.ensemble import IsolationForest
from datetime import datetime, timedelta

class APMonitor:
    def __init__(self):
        self.model = IsolationForest(contamination=0.01)
        self.metrics_history = []

    def collect_metrics(self):
        """Collect application metrics"""
        metrics = {
            'timestamp': datetime.now(),
            'cpu_usage': get_cpu_usage(),
            'memory_usage': get_memory_usage(),
            'response_time': get_response_time(),
            'error_rate': get_error_rate(),
            'request_count': get_request_count()
        }
        self.metrics_history.append(metrics)
        return metrics

    def detect_anomalies(self):
        """Detect performance anomalies"""
        if len(self.metrics_history) < 100:
            return None  # Not enough data

        # Prepare data for model
        features = np.array([
            [m['cpu_usage'], m['memory_usage'],
             m['response_time'], m['error_rate']]
            for m in self.metrics_history[-100:]
        ])

        # Train model and predict
        self.model.fit(features)
        predictions = self.model.predict(features)

        # Check latest prediction
        if predictions[-1] == -1:
            return self.metrics_history[-1]
        return None

    def predict_failure(self, window_minutes=30):
        """Predict potential failures"""
        if len(self.metrics_history) < 100:
            return False

        # Analyze trends
        recent = self.metrics_history[-10:]
        trend = np.polyfit(
            range(len(recent)),
            [m['error_rate'] for m in recent],
            1
        )[0]

        # Predict if trend continues
        if trend > 0.1:  # Error rate increasing
            return True
        return False

# Usage
monitor = APMonitor()
while True:
    metrics = monitor.collect_metrics()
    anomaly = monitor.detect_anomalies()
    if anomaly:
        alert(f"Anomaly detected: {anomaly}")

    if monitor.predict_failure():
        alert("Potential failure predicted")

    time.sleep(60)
Best Practices for AI APM
1. Collect Comprehensive Data
AI APM works best with comprehensive data collection. Gather metrics, logs, and traces from all parts of your application to give AI a complete picture.
2. Start with Critical Services
Begin AI monitoring with your most critical services. This allows you to validate the approach and demonstrate value before expanding to all services.
3. Tune Sensitivity Carefully
AI anomaly detection can be sensitive. Start with conservative settings and gradually increase sensitivity as you understand your application's normal behavior.
# Sensitivity tuning
sensitivity_config = {
    'initial': 'low',
    'after_1_week': 'medium',
    'after_1_month': 'high',

    # Adjust based on false positive rate
    'auto_tune': True,
    'target_false_positive_rate': 0.05
}
4. Integrate with Incident Response
Connect AI APM to your incident response workflow. When AI detects an issue, it should automatically create incidents, notify the right people, and suggest remediation steps.
# Incident response integration
incident_config = {
    'auto_create_incident': True,
    'severity_mapping': {
        'anomaly': 'P3',
        'predicted_failure': 'P2',
        'critical_anomaly': 'P1'
    },
    'notification_channels': ['slack', 'pagerduty'],
    'auto_remediation': True
}
The Future of AI APM
Looking ahead, AI APM will become even more intelligent. We can expect:
- Autonomous remediation that fixes issues automatically
- AI-driven capacity planning and resource optimization
- Predictive scaling based on usage patterns
- Natural language interfaces for querying performance data
- AI-generated performance optimization recommendations
Related Tools
Enhance your monitoring workflow with our AI Data Analyzer, AI Code Reviewer, JSON to CSV, and Regex Tester. These tools provide complementary capabilities for data analysis, code review, and performance optimization.
Frequently Asked Questions
What is AI-powered APM?
AI-powered Application Performance Monitoring uses machine learning to automatically detect performance issues, predict failures, and suggest optimizations without manual configuration.
How does AI improve monitoring?
AI analyzes patterns across metrics, logs, and traces to identify anomalies, correlate issues, and provide actionable insights faster than traditional rule-based systems.
Can AI predict application failures?
Yes, AI APM tools use historical data and pattern recognition to predict failures 15-60 minutes before they occur, enabling proactive intervention.
What's the difference from traditional APM?
Traditional APM requires manual threshold configuration and alert rules. AI APM automatically learns normal behavior and detects deviations without manual setup.
How do AI APM tools handle scale?
AI APM tools are designed for cloud-native architectures, handling millions of metrics per second with intelligent aggregation and sampling strategies.