Copilot Usage Metrics Now Name the Client: OpenCode, Codex, Zed, and What Your Dashboard Was Missing
💡 Tool Tip:JSON Formatter, JSON Diff, CSV to JSON Converter, Word Counter
Two GitHub changelog entries this week changed what a Copilot usage report can actually prove. On October 22, the customization arrays started reporting configured names — real skill, custom-agent, MCP-server, slash-command and plugin names instead of "other" or "custom" — with up to 25 entries per record instead of five. On October 23, a new totals_by_client array began capturing model traffic from tools that never sent editor telemetry, naming clients such as opencode, claude_code, codex, zed, copilot_cli, github_app, cloud_agent, code_review, vscode and jetbrains. If you run a Copilot budget, these two changes probably moved a number you previously trusted, and the reason is not that people started using more AI on Thursday.
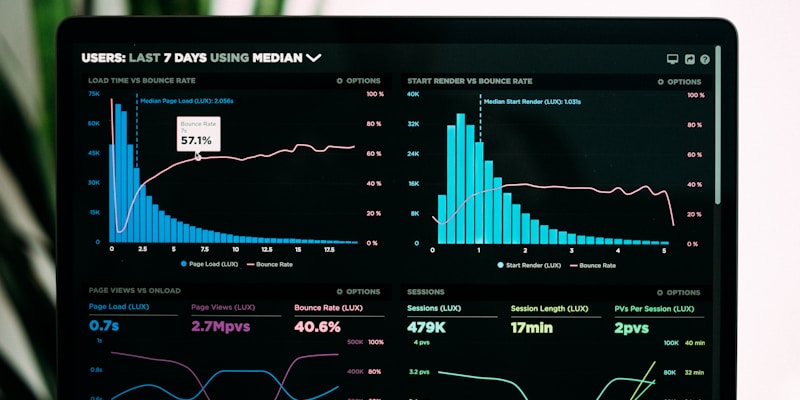
Server-side counting surfaced traffic that editor telemetry never saw.
The gap that totals_by_client closes
The old reports had totals_by_ide. Anything that ran inside an editor reported itself, and anything that did not was invisible. Over the past year a growing share of model traffic moved to tools that call Copilot as a provider from outside the IDE — a terminal agent, an app, an Agent Client Protocol integration — and those tools do not send editor telemetry. The traffic was real, it was billed, and it did not appear in the breakdown.
Counting requests on the server closes that hole. Each client entry carries request_count, session_count, and token_usage with prompt tokens, output tokens and average tokens per request, plus a totals_by_model breakdown. Unrecognised clients roll up under other, which turns the other line into a useful metric: if it grows, a tool your inventory does not know about is now in production.
One distinction to keep straight, because it is easy to conflate in a review. totals_by_client measures model traffic — requests and tokens — from any tool using Copilot. Agent app activity measures jobs started by agent apps such as Claude and Codex on GitHub. A team can start many agent jobs and generate almost no model traffic through Copilot, or the reverse. Both are real, and they answer different questions.
# Both changes land in the report JSON you already download, so start by reading the
# shape instead of guessing it. A 28-day aggregated report carries day_totals, and
# totals_by_client appears inside each entry, not only at the top level.

import json
from collections import defaultdict

report = json.load(open("report-28d.json"))

per_client = defaultdict(lambda: {"requests": 0, "sessions": 0,
                                  "prompt_tokens": 0, "output_tokens": 0})

for day in report.get("day_totals", []):
    for row in day.get("totals_by_client", []):
        c = per_client[row["client"]]
        c["requests"] += row.get("request_count", 0)
        c["sessions"] += row.get("session_count", 0)
        usage = row.get("token_usage") or {}
        c["prompt_tokens"] += usage.get("prompt_tokens", 0)
        c["output_tokens"] += usage.get("output_tokens", 0)

for client, row in sorted(per_client.items(), key=lambda kv: -kv[1]["requests"]):
    print(f"{client:14} req={row['requests']:>7} "
          f"sess={row['sessions']:>6} out_tok={row['output_tokens']:>10}")

# Unrecognised clients are grouped under "other", so an "other" line that keeps
# growing is a to-do item, not a rounding error.
Reconcile old and new before anyone asks
The first report after a change like this always produces an argument, because the delta looks like a spike. Prepare the explanation in advance: the client-wide number is larger than the IDE-only number by design, and the size of the gap tells you how much of your organisation's model usage was previously unaccounted for.
Access matters here too. These reports are available to enterprise owners and billing managers, organisation owners, and anyone holding a custom organisation or enterprise role that grants the View Copilot Metrics permission, and the Copilot usage metrics policy has to be enabled. If the person who owns the budget cannot see the report, the report is not doing its job.
And keep one caveat in the document rather than in your head: these metrics come from client telemetry and can undercount, for example when clients are outdated or telemetry is blocked. A dashboard that silently undercounts is worse than one that admits it, because the first thing a finance partner does is add up a sample by hand and find the difference.
# Reconcile before you report. Client-level accounting was added to close a gap --
# tools that run outside the editor never sent editor telemetry, so their traffic
# was absent from totals_by_ide. That means old and new numbers legitimately differ,
# and a jump is not automatically a regression or a spike in usage.

totals_by_ide = 0
totals_by_client = 0

for day in report.get("day_totals", []):
    totals_by_ide += sum(r.get("request_count", 0) for r in day.get("totals_by_ide", []))
    totals_by_client += sum(r.get("request_count", 0) for r in day.get("totals_by_client", []))

delta = totals_by_client - totals_by_ide
print("ide-only:", totals_by_ide, "client-wide:", totals_by_client, "delta:", delta)
print("delta share:", f"{delta / max(totals_by_client, 1):.1%}")

# Attach this to the first report after the change so nobody has to reconstruct
# why the line moved. If the delta is large, most of your organisation's model
# traffic was always coming from somewhere your dashboard could not see.

# Also distinguish model traffic from job activity: totals_by_client counts
# requests and tokens from any tool using Copilot, while agent app activity counts
# jobs started by agent apps such as Claude and Codex on GitHub. Different question.
model_selection_mode is the interesting field
Each entry in totals_by_model carries a model_selection_mode that says whether the model was requested directly (user_selected), picked by an automatic router (auto), or chosen by the product (product_selected). Unreported modes appear as other, and values that cannot be normalised appear as unknown. GitHub notes that code review and the cloud agent report product_selected because the product chooses the model.
That single field separates two very different stories. A large user_selected share means your spend tracks the choices your guidelines describe, and a model policy change will move the bill. A large product_selected share means defaults and automated features are shaping the bill, and telling engineers to pick a cheaper model will do almost nothing.
The practical use is boring and effective: report the share, not just the total. If product_selected is 40% of requests, the conversation about cost belongs with the people who own the automated features, not with the developers who are using them.
# model_selection_mode is the field that changes decisions. Each totals_by_model
# entry says whether the model was requested directly (user_selected), picked by
# auto, or chosen by the product (product_selected). Unreported modes appear as
# other, and values that cannot be normalised appear as unknown -- keep both
# visible instead of folding them into a total.

by_mode = defaultdict(int)
by_model = defaultdict(int)

for day in report.get("day_totals", []):
    for row in day.get("totals_by_client", []):
        for m in row.get("totals_by_model", []):
            n = m.get("request_count", 0)
            by_mode[m.get("model_selection_mode", "unknown")] += n
            by_model[m.get("model", "unknown")] += n

print("by selection mode:", dict(by_mode))
print("by model:", dict(sorted(by_model.items(), key=lambda kv: -kv[1])[:10]))

# If product_selected is a large share, your bill is being shaped by defaults and
# code review / cloud agent traffic, not by the model picker your guidelines describe.
# That is the sentence to bring to the next budget review.

Report the share of product-selected models, not only the total spend.
Named customizations created a small governance job
Real names are more useful and more dangerous than a catch-all. Names come from client telemetry, are trimmed, and are limited to 128 characters, and names that look like file paths deliberately stay grouped under other or custom. Coverage is limited to paths that report names: Copilot CLI interactive sessions and prompt mode, the Copilot app, Agent Client Protocol integrations such as JetBrains, and the Copilot SDK, with CLI 1.0.97 or later and SDK v1.0.21 or later. Names are not reported from an IDE's built-in chat telemetry.
Two obligations follow. First, the 25-entry cap means the long tail is truncated, so treat the list as a sample when your organisation has hundreds of skills. Second, names are human-authored text: someone will eventually name a skill after a customer, a ticket, or themselves. Review names before a report leaves the organisation, and keep the review as a scheduled step rather than a heroic catch.
The upside is genuine. If you roll out an internal MCP server and adoption stays at five interactions a week, you now know that in days rather than quarters, and the enablement conversation starts with evidence instead of a hunch.
# Names are now reported, which creates a governance job nobody asked for:
# names come from client telemetry, are trimmed, and are limited to 128 characters.
# Names that look like file paths stay grouped under other or custom.

import re

def review_names(report, max_show=25):
    issues = {"path_like": [], "too_long": [], "other_bucket": 0}
    for day in report.get("day_totals", []):
        for key in ("totals_by_skill", "totals_by_custom_agent", "totals_by_mcp",
                    "totals_by_slash_cmd", "totals_by_plugin"):
            rows = day.get(key, [])
            for row in rows:
                name = (row.get("name") or row.get("value") or "").strip()
                if name in ("other", "custom"):
                    issues["other_bucket"] += sum(row.get("interaction_count", 0) for r in [row])
                    continue
                if re.match(r"^[~./]", name):
                    issues["path_like"].append(name)
                if len(name) > 100:
                    issues["too_long"].append(name)
            if len(rows) > max_show:
                issues.setdefault("truncated", []).append((key, len(rows)))
    return issues

# Each list now carries up to 25 entries per record, up from five, with the rest
# rolled into a trailing "other". If your long tail is bigger than that, sample it
# deliberately rather than assuming the top 25 is the whole story.
print(review_names(report))

# Names are org-authored text. Review them before sharing a report outside the org,
# and check that nothing personal ended up in a skill or MCP server name.
A monthly review that survives an audit
Turn the report into three numbers and two caveats. The three numbers: total requests by client, the share of requests by model_selection_mode, and the count of unreported customization activity sitting under other. The two caveats: client telemetry can undercount, and IDE built-in chat does not report names.
Then automate the reconciliation so it runs before anyone asks. A script that prints the IDE-only versus client-wide delta every month, with the date the gap was introduced, ends the recurring argument about whether usage jumped. It also gives you a defensible answer on the day a security team asks which tools are actually reaching the model.
One last habit worth building while the data is new: name things so that the report is readable six months later. A custom agent called "pr-helper-2-final" is a future investigation. A custom agent called "infra-terraform-review" is a line item you can defend.
#!/usr/bin/env bash
# Monthly review, as a reproducible script instead of a slide someone rebuilt by hand.
set -euo pipefail

OUT="reports/copilot-$(date +%Y-%m)"
mkdir -p "$OUT"

echo "== pull reports =="
# Use the usage metrics API endpoints your org already calls; the 1-day and 28-day
# versions both expose totals_by_client, and the policy must be enabled.
echo "enterprise 28d -> $OUT/ent-28d.json"
echo "org 28d        -> $OUT/org-28d.json"

echo "== coverage sanity =="
python - <<'PY'
import json, glob
for path in glob.glob("reports/copilot-*/*-28d.json"):
    d = json.load(open(path))
    days = d.get("day_totals", [])
    with_client = sum(1 for x in days if x.get("totals_by_client"))
    print(f"{path}: {len(days)} days, {with_client} with client data")
PY

echo "== name hygiene =="
python - <<'PY'
print("check: <=128 chars, no path-like names, count entries beyond the 25 cap")
PY

echo "== caveat to print in the report itself =="
echo "client telemetry can undercount (outdated clients, blocked telemetry);"
echo "IDE built-in chat does not report names, only SDK-based agent experiences do."

Customisation names are human-authored text; review them before sharing the report.
📌 Frequently Asked Questions
What did the October 23, 2026 change add?
A totals_by_client array in the enterprise, organisation, enterprise-user and organisation-user reports, in both 1-day and 28-day versions. It captures model usage from tools such as OpenCode, Codex and Zed that were not previously in reports, and includes request counts, session counts, token usage and a per-model breakdown.
What changed on October 22, 2026?
The totals_by_skill, totals_by_custom_agent, totals_by_mcp, totals_by_slash_cmd and totals_by_plugin arrays now show configured names instead of grouping under other or custom, and each list carries up to 25 entries per record, up from five.
Why are my request numbers higher than before?
Client-level accounting counts requests on the server, so traffic from tools outside the IDE that never sent editor telemetry now appears. The gap against the older IDE-only breakdown is expected rather than a usage spike.
Who can see these reports?
Enterprise owners and billing managers, organisation owners, and anyone with a custom organisation or enterprise role granting the View Copilot Metrics permission. The Copilot usage metrics policy must be enabled.
How is this different from agent app activity?
totals_by_client measures model traffic, meaning requests and tokens, from any tool using Copilot. Agent app activity counts jobs started by agent apps such as Claude and Codex on GitHub. They measure different things and should not be summed.
🔧 Recommended Tools
JSON Formatter
Read day_totals and totals_by_client without guessing the shape.
JSON Diff
Compare this month's report against last month's field by field.
CSV to JSON Converter
Turn a review table into something a script can check.
Word Counter
Check name lengths against the 128-character limit.
AI Token Counter
Sanity-check reported token totals against your own sample.