NVIDIA's Minerva Maps an AI Factory Into a Knowledge Graph So a Slow Job Can Be Traced to the Cable
💡 Tool Tip: SQL Formatter, JSON Formatter, Timestamp Converter
On October 22, 2026, NVIDIA announced Minerva, positioned as an AIOps platform that joins infrastructure telemetry with AI workload telemetry and applies purpose-built models to turn that data into timely, actionable insight. The more revealing part is how the announcement describes an AI factory at all: vast numbers of GPUs working across high-speed networks to train models and serve applications, where a single degraded component can slow an entire job and the warning signs are easy to miss — a GPU running hotter than its peers, an NVMe drive losing performance under load. Those are not failures. They are a component being slightly worse than its neighbours, which is precisely the class of signal traditional monitoring is bad at.
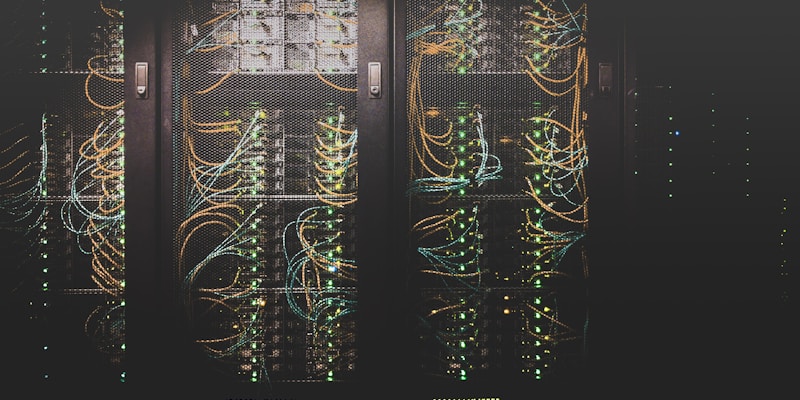
Minerva links GPUs, SuperNICs, switches, cables and the jobs running on them.
1. It measures yield, not uptime
The post defines the metric narrowly: AI factory yield is the useful work the infrastructure produces, expressed through GPU hours, goodput, cluster uptime and token production. Putting those four together is deliberate. GPU hours tell you what you bought. Goodput tells you how much of it moved a job forward. Uptime tells you whether the cluster was running. Token production translates the abstraction into something a business can hear. The distinction earns its keep because a cluster can sit at 92% utilisation and deliver 30% less useful output — jobs stalled behind a slow node still hold their GPUs, sampling rates do not dip, and the invoice does not shrink. So the first chart on your own dashboard should not be utilisation. It should be tokens per useful GPU-second, because that line moves before the bill does.
-- Yield is the only metric that survives a budget review.
-- GPU hours alone tell you what you paid for; goodput tells you what you got.
WITH per_node AS (
  SELECT
    node_id,
    sum(seconds)                                        AS wall_seconds,
    sum(seconds * busy_fraction)                        AS busy_gpu_seconds,
    sum(seconds * useful_fraction)                      AS useful_gpu_seconds,
    sum(tokens_generated)                               AS tokens
  FROM gpu_samples
  WHERE ts >= now() - INTERVAL '24 hours'
  GROUP BY node_id
)
SELECT
  round(sum(useful_gpu_seconds) / sum(busy_gpu_seconds) * 100, 2) AS goodput_pct,
  round(sum(busy_gpu_seconds) / sum(wall_seconds) * 100, 2)       AS utilisation_pct,
  round(sum(tokens) / nullif(sum(useful_gpu_seconds), 0), 2)      AS tokens_per_useful_gpu_second,
  count(*)                                                         AS nodes
FROM per_node;

-- Two clusters can show 92% utilisation and differ by 30% on yield.
-- Track tokens per useful GPU-second; it moves before the bill does.
2. Topology as the join key nobody stores
The most consequential technical sentence in the post is that Minerva builds a dynamic knowledge graph that logically maps the infrastructure — GPUs, SuperNICs, switches and cables — and the jobs running on it. The weight is in the word logically, because most teams do not store topology at all. They have an inventory, they have switch configs, they have scheduler records, but the chain from "this job ran on these nodes, which hang off that leaf switch, and that GPU's NIC runs through this cable" usually lives in one person's head. Without it, an NCCL timeout alert reports a symptom and nothing else. With it, the same alert carries blast radius: one GPU or one rack? That answer decides whether you page one person or half the team.
// Topology is the join key that nobody stores. Minerva's pitch is that
// it does: GPUs, SuperNICs, switches, cables and jobs in one graph.

// Given a training job that lost throughput, walk from job to the
// physical component that changed, and stop at the first shared ancestor.
MATCH (j:Job {id: $job_id})-[:RAN_ON]->(n:Node)
MATCH (n)-[:HAS_GPU]->(g:GPU)
MATCH (g)-[:ATTACHED_TO]->(:NIC)-[:CABLE]->(sw:Switch)
WHERE g.hotspot_c > g.peer_median_hotspot_c + 5
   OR sw.crc_errors_1h > 100
RETURN
  j.id            AS job,
  collect(DISTINCT n.id)  AS nodes,
  collect(DISTINCT g.id)  AS suspect_gpus,
  collect(DISTINCT sw.id) AS suspect_switches,
  count(DISTINCT n.id)    AS blast_radius
ORDER BY blast_radius DESC;

// The blast radius is the point. One bad switch is a rack problem;
// one bad GPU is a node problem. Same alert, different page.
3. Anomaly detection at billions of points per hour is peer-relative
Minerva analyses billions of datapoints per hour using supervised and unsupervised machine learning, learning normal behaviour, detecting previously unseen anomalies, predicting emerging failures and correlating events by topology. The phrase that matters is learning normal behaviour, because it implies the baseline is relative rather than fixed. For hardware telemetry that is the only workable choice: the same batch of GPUs looks different under different firmware, inlet temperatures and neighbour load, so a hard-coded "alert above 85 degrees" either pages constantly or misses the real thing. The tractable substitute is grouping by rack and scoring with median and MAD — the median absolute deviation is not dragged around by the outliers you are hunting. That one decision is copyable into any homegrown stack this afternoon.
A GPU running 8 degrees hotter than its peers is how a whole job slows down.
// Peer-relative detection beats static thresholds on hardware that
// drifts with firmware, workload mix and inlet temperature.
import statistics

def peer_anomalies(samples, metric="hotspot_c", k=6.0):
    """samples: [{gpu_id, rack_id, ts, hotspot_c}, ...]"""
    by_rack = {}
    for s in samples:
        by_rack.setdefault(s["rack_id"], []).append(s)

    flagged = []
    for rack_id, rows in by_rack.items():
        values = [r[metric] for r in rows]
        med = statistics.median(values)
        # MAD resists the very outliers we are hunting.
        mad = statistics.median([abs(v - med) for v in values]) or 0.1
        for r in rows:
            score = 0.6745 * (r[metric] - med) / mad
            if score > k:
                flagged.append({
                    "gpu_id": r["gpu_id"],
                    "rack_id": rack_id,
                    "score": round(score, 2),
                    "value": r[metric],
                    "peer_median": med,
                })
    return sorted(flagged, key=lambda x: -x["score"])

# Run per rack, not per cluster: inlet temperature and neighbour load
# differ by rack, and a cluster-wide median buries a hot rack.
4. An event storm collapses into one ticket
One plain sentence in the post deserves attention: instead of sending every symptom to an operator, it can group an event storm into a focused incident with a likely root cause. That is the expensive problem in operations — not detecting failure, but deciding whether the forty alerts that just arrived are one event. Technically it needs two things: topology, because alerts sharing a switch are probably the same fault, and suppression rules, because child symptoms should go quiet while a parent fault is open. The rules matter more than the tool. Group by rack, switch and job; suppress children of a switch fault; collapse five or more alerts on one job into a single ticket with suspect components attached; and hold one line firm — uncorrectable ECC, NVLink down and thermal shutdown are never suppressed, because they are integrity signals rather than noise.
# An event storm is a topology problem wearing an alerting costume.
# Group by shared physical ancestor before paging a human.
correlation:
  window: 10m
  group_by:
    - topology.rack_id
    - topology.switch_id
    - job.id
  rules:
    - name: suppress_children_of_switch
      when: any(alert.name == "switch_crc_errors")
      suppress:
        - gpu_xid_error
        - nccl_timeout
        - job_throughput_drop
      reason: "child symptoms of one fabric fault"

    - name: single_ticket_per_job
      when: count(alert.job.id) >= 5
      collapse_to: job_throughput_drop
      attach: [suspect_components, blast_radius]

    - name: never_suppress
      alerts: [ecc_uncorrectable, nvlink_down, thermal_shutdown]
      reason: "hardware integrity signals are never noise"

# Result: one page with a blast radius instead of 40 pages with a start time.
5. Human in the loop, or automation with a written policy
Minerva ships a native AI assistant and connects to external agentic AI tools. Operators can investigate cluster health in natural language and receive recommended remediation, and teams can keep a person implementing the fix or wire Minerva to automation through infrastructure APIs. That freedom is where the risk lives. The engineering answer is to grade actions before enabling any of it: restarting an idle container is low risk and can go straight through; draining a node or resetting NVLink is medium risk and needs a named on-call approver; evicting a job or pushing firmware is high risk and needs the job owner or a change board. Then every agent-initiated action runs dry first, writes what it would do into the ticket, and executes only after a human says yes. A dry run costs nothing, and the one mis-eviction it prevents can be three weeks of training. The same logic applies to the assistant itself: it should propose, cite the telemetry it read, and hand the decision back, because an incident is exactly the moment when an unreviewed action costs the most.
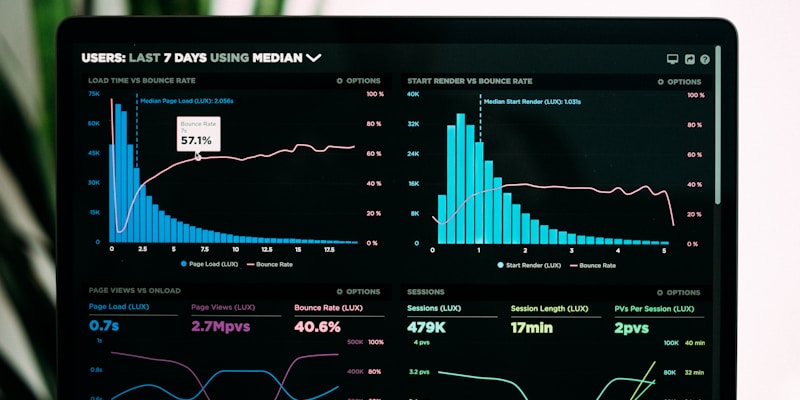
The distance between an alert storm and one ticket is topology plus deduplication.
// Remediation through infrastructure APIs is the part that needs a policy,
// not a demo. Dry-run first, then require a named approver for anything
// that moves a job or drains a node.

REMEDIATION = {
    "restart_idle_container":   {"risk": "low",    "approval": None},
    "drain_node":               {"risk": "medium", "approval": "oncall"},
    "reset_nvlink":             {"risk": "medium", "approval": "oncall"},
    "evict_job":                {"risk": "high",   "approval": "owner"},
    "firmware_update":          {"risk": "high",   "approval": "change_board"},
}

def remediate(action, target, incident, dry_run=True):
    policy = REMEDIATION[action]
    if dry_run:
        return {"would_do": action, "target": target, "risk": policy["risk"]}
    if policy["approval"] and not incident.get("approved_by"):
        raise PermissionError(f"{action} needs {policy['approval']} approval")
    return infra_api.execute(action, target, incident_id=incident["id"])

# Write the dry-run output into the ticket. The agent proposes,
# the human approves, the API executes, the graph records what changed.
📌 Frequently Asked Questions
When was Minerva announced?
October 22, 2026, on the NVIDIA blog, in a post by Brian Sparks. It is positioned as an AIOps platform for AI factories that joins infrastructure telemetry with AI workload telemetry.
How is AI factory yield defined?
The post names four dimensions: GPU hours, goodput, cluster uptime and token production. It measures useful work produced rather than raw utilisation, so a highly utilised cluster stalled behind slow nodes yields less.
What does the knowledge graph actually buy you?
Attribution. The graph maps GPUs, SuperNICs, switches, cables and the jobs running on them, so a slow training job can be traced to the component affecting it even across hundreds of thousands of GPUs. Operationally that becomes blast radius: are these alerts one GPU or one rack.
Who is using it?
IREN is named as a partner already using Minerva, with Aolani, Bitdeer AI, IBM, Jio, Lambda, Quake AI and Tesla planning to deploy. Dell, Lenovo and Supermicro will offer Minerva within their AI factory operations portfolios.
Should remediation be fully automated?
Not without a policy. NVIDIA explicitly keeps a human-in-the-loop option. In practice: grade actions by risk, default to dry-run, require named approval for anything that moves a job or drains a node, then execute the approved action through infrastructure APIs.